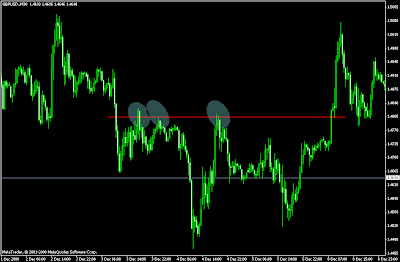
HOW TO APPLY SUPPORT/RESISTANCE AS SIMPLE TRADING STRATEGY [BAGIAN 2]

>> Selasa, 30 Desember 2008

APLIKASI SUPPORT DAN RESISTANCE SEBAGAI SEBUAH STRATEGI?
Setelah memahami apa itu support dan resistance tentunya rekan rekan trader mendapatkan sebuah gambar bagaimana bertrading dengan menggunakan support dan resistance. Ya tepat sekali kita bertrading dengan cara fading, counter trend, melawan trend, meletakan order kita (limit order) pada level dan berharap harga berbalik.
Sekarang kita coba ingat prinsip dasar Analisis Teknikal ‘until the weight of evidence proves and shows the trend has been reversed’…filosofi yang seharusnya terus dipegang oleh kita, don’t fight the market, be friend with the trend until it bend. wah kontradiktif dong dengan prinsip entry berdasar S/R?.Nah oleh karena itulah dalam hal ini kita harus belajar dan memahami perilaku gelombang harga sebelum mengaplikasikan support dan resistance sebagai trading strategi kita.

MENGENALI SIFAT SUPPORT DAN RESISTANCE
1. Sebuah level support dan resistance (S/R) akan bekerja dengan baik apabila pada waktu sebelumnya telah berperan baik dengan menahan laju gerak harga, dalam hal ini paling tidak kita mencari 2 kali peristiwa di mana level tersebut bekerja.
2. Sebuah level S/R yang tertembus/terbreak akan bertukar peran, support menjadi resistance, resistance menjadi support.

MEMAHAMI TREND, RETRACEMENT
Apa itu trend?
Markets have three trends, an uptrend (trend 1) as a time when successive rallies in a security price close at levels higher than those achieved in previous rallies and when lows occur at levels higher than previous lows. Downtrends (trend 2) occur when markets make lower lows and lower highs. It is this concept of Dow Theory that provides the basis of technical analysis definition of a price trend. Dow described what he saw as a recurring theme in the market: Prices would move sharply in one direction, recede briefly in the opposite direction, and then continue in their original direction (trend 3).

Menurut cuplikan Dow theory di atas trend terjadi ketika kita harga yang bergerak berkesinambungan membentuk higher low (dalam uptrend) atau lower high (dalam downtrend). Ini berarti bahwa dalam sebuah trend, harga tidak bergerak dalam sebuah garis lurus yang tajam melainkan bergerak dalam prinsip gelombang (gerakan naik dan turun terjadi berulang ulang). Dan prinsip inilah yang akan kita manfaatkan dalam trading strategi yang akan kita gunakan.

Retracement?

Harga tidak bergerak dalam satu garis lurus yang tajam, melainkan dalam gelombang yang bergerak naik dan turun. Gerakan melawan arah trend yang diikuti dengan terbentuknya higher low atau lower high itulah yang akan kita kenal sebagai retracement.

bersambung ...

HOW TO APPLY SUPPORT/RESISTANCE AS SIMPLE TRADING STRATEGY [BAGIAN 1]

>> Senin, 29 Desember 2008

Successful trading stands on three pillars. You need to analyze the balance of power between bulls and bears. You need to practice good money management. You need personal discipline to follow your trading plan and avoid getting high in the markets.

APA ITU SUPPORT DAN RESISTANCE?
Pada dasarnya support dan resistance adalah alat analisa dasar yang digunakan baik dalam intraday trading, swing trading , maupun hold position trading. Artinya support dan resistance bekerja dalam timeframe apapun, short term, mid term, dan long term.
Kenapa support dan resistance efektif untuk diterapkan dalam trading?
Support dan resistance efektif karena trader berpengalaman, hedge fund manager dan trader institutional menggunakannya, singkat cerita professional trader menggunakan support dan resistance. Karena digunakan secara luas maka support dan resistance memiliki pengaruh yang sangat nyata terhadap pergerakan gelombang harga. Dalam hal ini pada akhirnya support dan resistance berperan karena diikuti, atau keren nya kita sebut self fulfilling prophecy hehe.

Support adalah level di mana seller melepas posisinya dan mengambil profit dan buyer mulai membuka posisinya, akibatnya harga berhenti untuk turun dan berbalik naik. Minor support mengakibatkan harga berbalik sementara, sedangkan major support memberikan dampak yang lebih signifikan.


Resistance adalah kebalikan dari support, resistance adalah level di mana buyer mulai melepas posisinya dan seller mulai mebuka posisinya, akibatnya harga berhenti naik dan berbalik turun. Sebagaimana support, minor resistance memberikan dampak sementara sedangkan major resistance membalikan harga dengan lebih signifikan.


bersambung ...

DOW THEORY

>> Sabtu, 06 Desember 2008


Dow Theory is a theory on stock price movements that provides the basis for technical analysis. The theory was derived from 255 Wall Street Journal editorials written by Dow. Following his death, William P. Hamilton, Charles Rhea, and E. George Schaefer organized and collectively represented “Dow theory” based on Dow’s editorials. Dow himself never used the term Dow Theory, though. The six basic tenets of Dow Theory, as summarized by Hamilton, Rhea, and Schaefer, are as follows:

1. Markets have three trends. To start with, Dow defined an uptrend (trend 1) as a time when successive rallies in a security price close at levels higher than those achieved in previous rallies and when lows occur at levels higher than previous lows. Downtrends (trend 2) occur when markets make lower lows and lower highs. It is this concept of Dow Theory that provides the basis of technical analysis definition of a price trend. Dow described what he saw as a recurring theme in the market: Prices would move sharply in one direction, recede briefly in the opposite direction, and then continue in their original direction (trend 3).

2. Trends have three phases. Dow Theory asserts that major market trends are composed of three phases: an accumulation phase, a public participation phase, and a distribution phase. The accumulation phase (phase 1) occurs when investors “in the know” are actively buying (selling) stock against the general opinion of the market. During this phase, the stock price does not change much because these investors are in the minority, absorbing (releasing) stock that the market at large is supplying (demanding). Eventually, the market catches on to these astute investors, and a rapid price change occurs (phase 2). This is when trend followers and other technically oriented investors participate. This phase continues until rampant speculation occurs. At this point, the astute investors begin to distribute their holdings to the market (phase 3).

3. The stock market discounts all news. Stock prices quickly incorporate new information as soon as it becomes available. Once news is released, stock prices will change to reflect this new information. On this point Dow Theory agrees with one of the premises of the efficient-market hypothesis.

4. Stock market averages must confirm each other. In Dow’s time, the United States was a growing industrial power. The United States had population centers, but factories were scattered throughout the country. Factories had to ship their goods to market, usually by rail. Dow’s first stock averages were an index of industrial (manufacturing) companies and rail companies. To Dow, a bull market in industrials could not occur unless the railway average rallied as well, usually first. The logic is simple to follow: If manufacturers’ profits are rising, it follows that they are producing more. If they produce more, then they have to ship more goods to consumers. Hence, if an investor is looking for signs of health in manufacturers, he or she should look at the performance of the companies that ship manufacturers’ output to market, the railroads. The two averages should be moving in the same direction. When the performance of the averages diverges, it is a warning that change is in the air.

5. Trends are confirmed by volume. Dow believed that volume confirmed price trends. When prices move on low volume, there could be many different explanations why. An overly aggressive seller could be present, for example. However, when price movements are accompanied by high volume, Dow believed that this represented the true market view. If many participants are active in a particular security, and the price moves significantly in one direction, Dow maintained that this was the direction in which the market anticipated continued movement. To him, it was a signal that a trend is developing.

6. Trends exist until definitive signals prove that they have ended. Dow also believed that trends existed despite market noise. Markets might move in the direction opposite the trend temporarily, but they soon will resume the prior move. The trend should be given the benefit of the doubt during these reversals. Determining whether a reversal is the start of a new trend or a temporary movement in the current trend is not easy. Dow theorists often disagree in this determination. Technical analysis tools attempt to clarify this, but they can be interpreted differently by different investors.

Source : Forex Wave Theory a Technical Analysis for Spot and Futures Currency Traders; Bickford, James L.; The McGraw-Hill Companies; 2007

  © Blogger templates Romantico by Ourblogtemplates.com 2008

Back to TOP